
Guides United States

United States · Economics · 4 min read

Sixty percent for food and labour. Everything else has to fit in the rest.

A US franchise unit is judged on a short list of ratios, and most of them are percentages of the same number: gross sales. Get sales wrong and every benchmark moves at once — which is why the trading area matters more than any single line of the P&L.

Published · Published industry and statutory figures, restated with sources. Not legal, financial or investment advice.

  • Prime cost
  • Average unit volume
  • Four-wall EBITDA
  • Occupancy cost ratio
  • Restaurant franchise

Controllable cost

Prime cost: food and labour, under 60%.

In restaurant and food franchises the core measure of store operations is prime cost: cost of goods sold plus total labour, including payroll taxes and benefits, as a share of gross sales. Well-run quick-service and food units hold it below 60%, and benchmarks put the healthy range at 55% to 60%.

The rest of each sales dollar has to cover the lease and the franchisor. Occupancy — rent, NNN charges and related costs — targets 6% to 10% of sales, and royalties with brand-fund contributions typically take 6% to 9% combined. A unit that lets prime cost drift above 60% squeezes the margin that services its debt.

Benchmarks

Seven numbers a lender and a franchisor both read.

Average unit volume measures top-line productivity and local demand. Same-store sales separate growth in existing units from growth that comes from opening new ones. Four-wall EBITDA is what the store earns before any corporate overhead, and it is the pool from which debt service and the owner's return are both paid.

Scroll sideways to see all columns

Published industry benchmarks, restated. They vary by vertical, format and market; use them to read a pro forma critically, never as a forecast for a specific unit.
MetricBenchmarkHow it is calculated
Prime cost55% – 60% of gross sales(Cost of goods sold + total labour) ÷ gross sales
Occupancy cost ratio6% – 10% of gross sales(Rent + NNN and related occupancy costs) ÷ gross sales
Royalty and brand fund6% – 9% of gross sales, combinedSet by the franchise agreement
Average unit volumeVertical-specific; roughly $800K to $3M+Trailing twelve-month gross sales per unit
Same-store salesPositive growth after inflationSales change across units open in both periods
Four-wall EBITDA15% – 25% of gross salesStore operating income before corporate overhead
Debt-service coverage1.25x – 1.35x minimumCash flow available for debt service ÷ annual principal and interest

The denominator

Every ratio divides by sales.

Look at the benchmark table again: prime cost, occupancy, royalties and four-wall margin are all percentages of gross sales. An operator can manage labour scheduling and food waste after opening. What they cannot manage after signing is the size of the trading area, the competition inside it, and the rent they agreed to pay for access to it.

That is how the same format, franchise agreement and lease can produce a healthy four-wall margin in one location and a loss in another. The franchise system sets the cost structure; the address sets the denominator.

Where this platform fits

Find out what a space can carry before you commit to it.

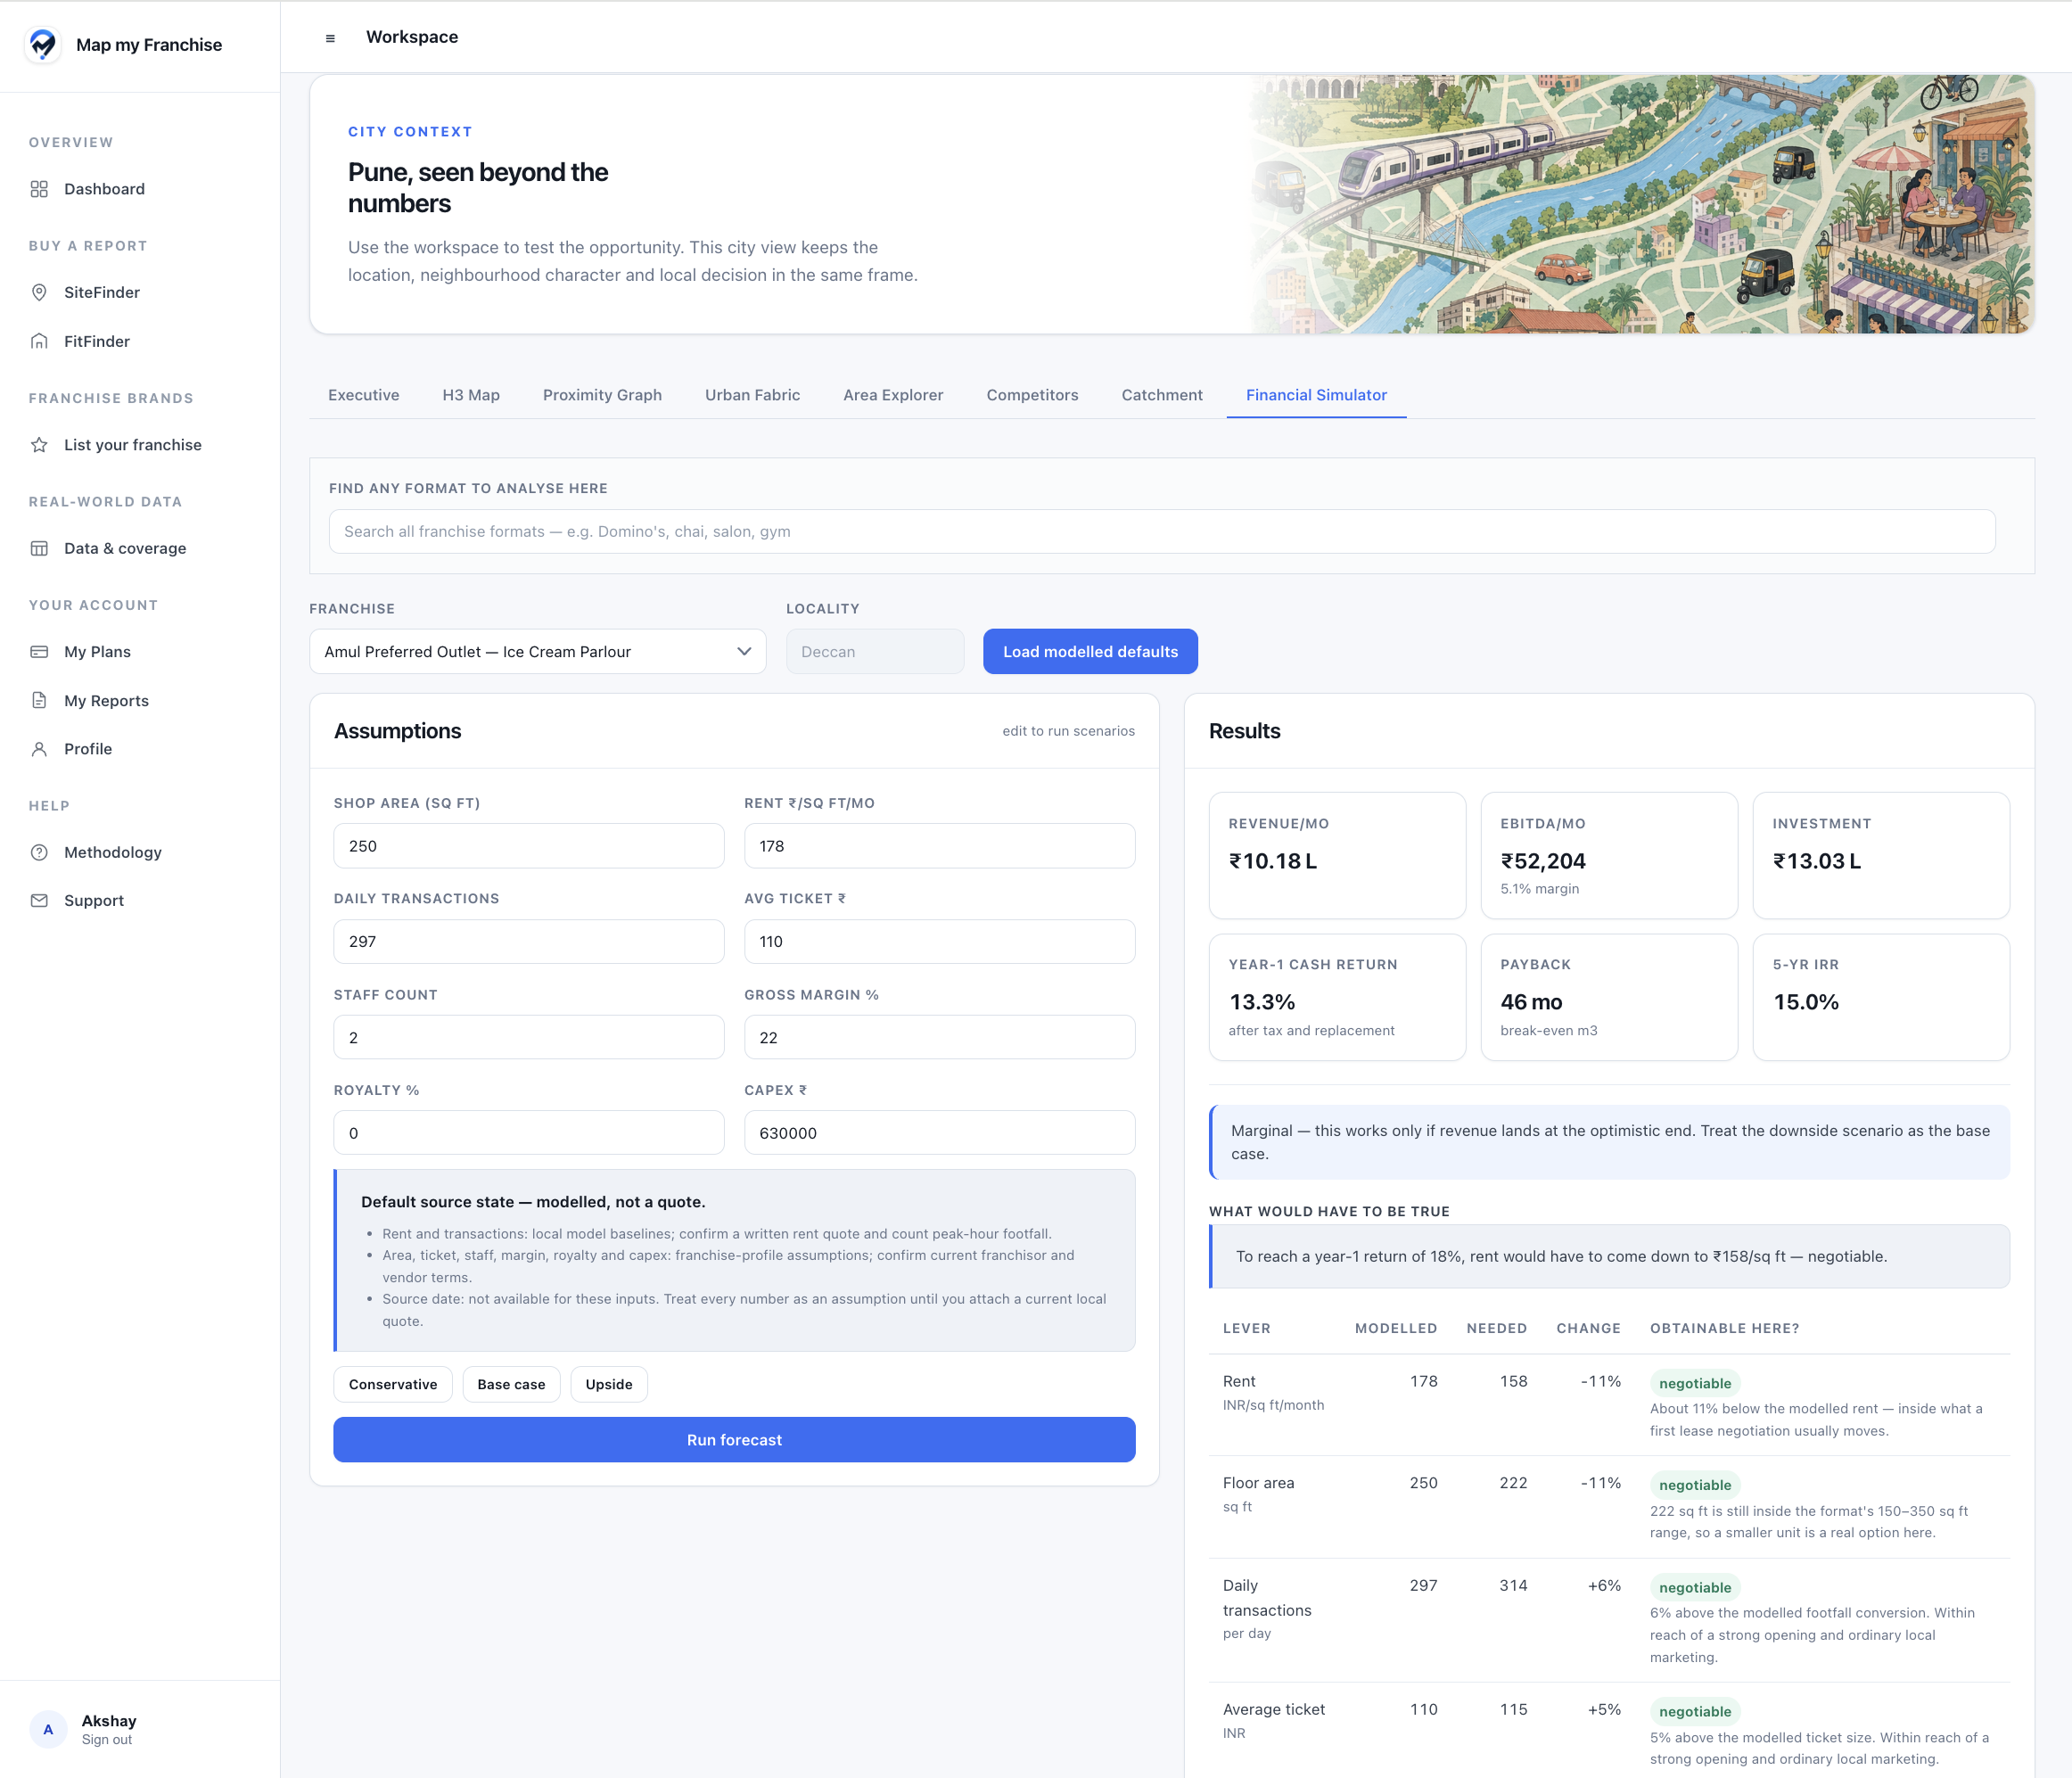
If you hold or are being offered a property, the useful question is what this space can carry — at this rent, with this catchment and this competition. FitFinder reads one locked site and tests which categories and franchise formats its demand, competition and physical fabric support, and what a target return would require you to change.

  • Categories assessed first, brands second, against one fixed address
  • Rent, deposit, floor area, staffing, royalties and capex all adjustable inputs
  • Conservative, base and upside scenarios with your budget visible throughout
  • The gap stated plainly when nothing clears the return you need

The benchmarks above are published industry ranges, not quotations. A franchisor's actual cost structure is in its FDD and your lease sets your occupancy cost; those are the numbers a financial model should be rebuilt on.

Product example · Pune, India. Modelled planning scenarios.

FitFinder Financial fitActual product screen
FitFinder financial simulator showing Amul assumptions, modelled returns and a table of rent, area and transaction changes needed to reach a target. Original product screenshot Enlarge & inspect
Amul Preferred Outlet · Deccan. The target-return calculation is a scenario, not a guarantee that the required rent or trading levels are achievable.
Where FitFinder is available today
  • Open for purchase now: any city in the world. The report is delivered within 2 days of payment. Featured cities: Mumbai, New York City, Pune, Dubai, Nagpur, Gurugram, Rajkot, Copenhagen.
  • Open in United States: every town and city — featured cities include New York City.
  • BrandReach carries no city, so a brand anywhere can be listed today.
Ask about a US city

Questions this guide raises.

What is a good prime cost for a franchise restaurant?

Published benchmarks put healthy quick-service and food units at 55% to 60% of gross sales, with 60% as the ceiling operators manage to. It varies by format — a full-service kitchen carries more labour than a counter-service concept — so compare against the franchisor's own disclosed figures and validation calls, not against one industry number.

Can a model tell me my unit's four-wall margin?

It can tell you what would have to be true for a given margin: the sales, rent and cost assumptions it rests on. Modelled economics here are planning scenarios — not forecasts, not offers and not a promise of return — and every figure carries a label showing whether it was observed, derived, modelled or supplied by you.

Sources

This guide restates published material. Where a figure matters to a decision you are about to make, read it at the source — regimes change, and a summary is only as current as the day it was written.

Statutory disclosure windows, lease regimes and competition rules differ by jurisdiction and change with legislation. Nothing on this page is legal, tax, financial or investment advice; take the documents in front of you to your own counsel.

Bring the evidence
into the decision.

See plans & pricing

Product screenshot

Read details opens at the key analysis. Scroll to explore; Actual size shows every pixel.

Original product screenshot. Example values and assumptions require verification.